


SPC Training app for iPhone and iPad
Developer: MicroMultimedia Pty Ltd
First release : 17 Feb 2019
App size: 152.71 Mb
Statistical Process Control and Control charts, or Process Behaviour Charts, are at the heart of quality. They are the only tool that can monitor and aid in improving processes. Control Charts are the only tool that can predict process behavior into the future.
This application is essential for every employee. It uses interactive games and exercises to teach the fundamentals of Control Charts. It teaches how to draw them, without the need for statistical software, how to use them, and interpret them. It shows how to use control charts for any type of data.
Today, there is a greater lack of understanding of Control Charts than ever in the past 3 decades. A great number of myths and nonsense has grown up around them. For example, Control Charts are NOT probability charts; Control Charts do NOT depend on normal distributions; Control Charts do NOT depend on the Central Limit Theorem; Control Charts do NOT require standard deviation calculations; Control Charts do not need assignable cause to be removed to calculate control limits; adding Western Electric Rules beyond Rule #1 simply increases false alarms. There is a massive need for re-education in Control Charts
This application cuts through the nonsense and teaches Control Charts as they are intended, based on Dr Shewhart, Professor Deming and Dr Wheeler. When used correctly, Control Charts are easy to use and understand by every employee.
This application makes understanding enjoyable, through the use of interactive games and exercises. One such game is based on a true story in process improvement, over a century ago. By playing games to generate data, Control Charts become much more meaningful. Our aim has been to make every module something different and exciting ... a dramatic departure from the boring e-learning of the past.
Most importantly, the interactive exercises learners a feeling of the meaning of the various types of Control Charts. It shows interactively how effective XmR charts are and how they do not rely on any particular data distribution. No amount of reading or watching videos, will ever convey the message given by actually doing it.
If you enjoy this app, please consider the corporate Q-Skills3D, training in quality, with user progress reporting.
The modules in this app are:
How to use this course
Interactive exercise - Control Charts vs Run Charts and why they are needed.
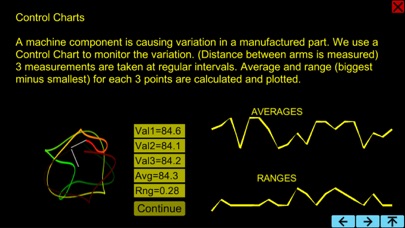
Description. Terminology. Capability. Based on graphical chaotic system.
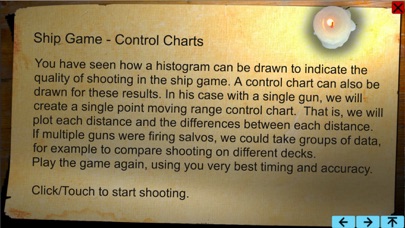
Interactive game, showing the effect of a true historical process improvement
Control Chart alerts exercise
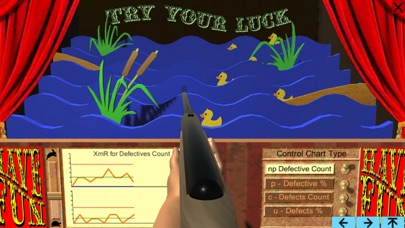
Count Data Control Charts with interactive game.
Summary
Quiz